Accuracy Verification Experiment
The sample creation method and accuracy verification method are shown below. The unit is [mm] except for mean curvatures.
〈Sample Creation Method〉
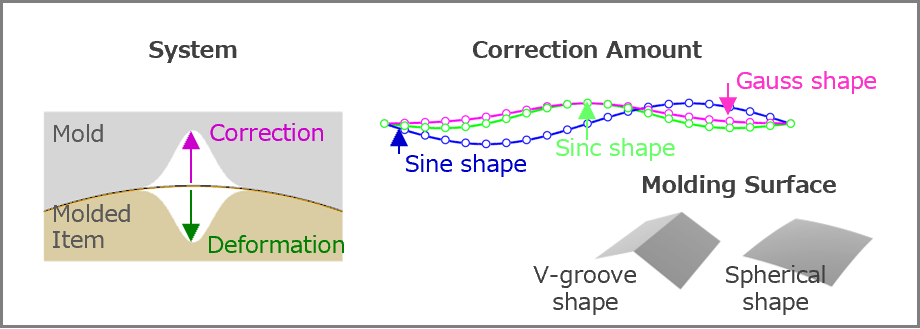
- We assume that the deformation shape of molded items is assumed to be (1) Gaussian shape: zd=-a·exp(-9(x2+y2)/200), (2) Sinc shape: zd=-a·sin(0.2π(x2+y2)½)/0.2π(x2 + y2)½, and (3) Sine: zd=-a·sin(0.1πx).
- We assume that the evaluation data points of the molded items are distributed in a grid pattern (range: |x, y|≤10 and intervals (x & y direction): 1).
- We assume that the spatial distribution shape of correction amounts zc (zc = -zd).
- We prepare ① CAD model with V-groove shape: zm=-0.5·|x| and ②CAD model with Spherical shape: zm=(1002-(x2+y2))½.
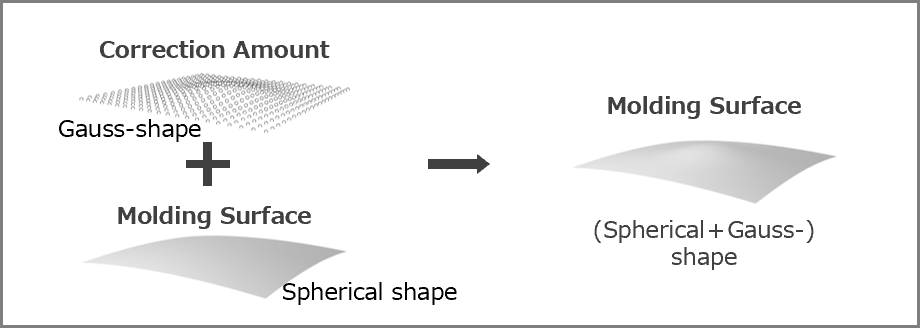
- We correct the above CAD models by utilizing our technology so as to approach the target shapes zt (zm+zt) along the z direction.


〈Accuracy Verification Method〉
- We obtain point cloud data of the corrected CAD models {x, y, zcc} and point cloud data of the un-corrected CAD models {x, y, zm} at 0.05 intervals (x&y directions) in the range of |x, y| ≤ 10.
- We obtain {x, y, Δz (= |(zcc-zm)-zt|)} and the maximum value Δzmax of the {|Δz|}.
- We obtain {x, y, ΔH (= mean curvature)} and the maximum value ΔHmax of the {|ΔH|}.
〈Result〉
Since Δzmax and Δhmax are extremely small (TableⅠ & TableⅡ), it can be seen that this service can perform highly accurate mold correction. In addition, since almost no local unintentional curvatures to the corrected shape occurs (Fig. 4), it can be seen that the corrected shape after using this service is easy to use in the post-process.
| Δzmax [mm] | Correction Amount: Gauss shape | Correction Amount: Sinc shape | Correction Amount: Cosine shape | |||||
| a=0.25 | a=0.50 | a=0.25 | a=0.50 | a=0.25 | a=0.50 | |||
| Molding Surface: V-groove shape | 3.7 e-4 | 6.6 e-4 | 5.3 e-4 | 9.6 e-4 | 2.8 e-4 | 4.8 e-4 | ||
| Molding Surface: Spherical shape | 3.6 e-4 | 7.2 e-4 | 5.5 e-4 | 1.0 e-3 | 4.5 e-4 | 3.8 e-4 | ||
| ΔHmax | Correction Amount: Gauss shape | Correction Amount: Sinc shape | Correction Amount: Cosine shape | |||||
| a=0.25 | a=0.50 | a=0.25 | a=0.50 | a=0.25 | a=0.50 | |||
| Molding Surface: V-groove shape | 1.4 e-2 | 2.3 e-3 | 1.7 e-2 | 2.0 e-3 | 1.1 e-2 | 1.3 e-2 | ||
| Molding Surface: Spherical shape | 1.6 e-3 | 3.3 e-3 | 1.1 e-3 | 4.2 e-3 | 6.4 e-4 | 6.4 e-4 | ||
Please check here for how to use this service.